The headline numbers
Here are the most recent official figures available at the time of writing (September 2026), with sources.
| Measure | Figure | Period | Source |
|---|---|---|---|
| Overseas visitor arrivals | 3.51 million, up 196,000 on the prior year | Year ended December 2025 | Stats NZ, International travel: December 2025 |
| Total tourism expenditure | $46.6 billion, up 3.3% | Year ended March 2025 | Stats NZ, Tourism satellite account |
| International visitor spend | About $18.1 billion | Year ended March 2025 | Tourism satellite account, as reported by Hospitality Business |
| Domestic tourism spend | About $28.5 billion | Year ended March 2025 | As above |
| Tourism share of GDP (direct and indirect) | 7.7% | Year ended March 2025 | As above |
Two things stand out. Tourism is a big part of the economy, and domestic travellers spend more than international visitors. For many regional businesses, school holidays and long weekends matter as much as international flight schedules.
How seasonality shows up
National totals hide the swings that individual businesses feel. Broadly:
- Summer (December to February) is the national peak, driven by domestic holidays and international visitors escaping the northern winter.
- Autumn (March to May) stays reasonably busy with international visitors, then tails off.
- Winter (June to August) is the quietest period for most coastal and northern regions, but the peak for ski areas.
- Spring (September to November) is a shoulder season that builds towards summer.
Regional patterns
Queenstown and the Southern Lakes
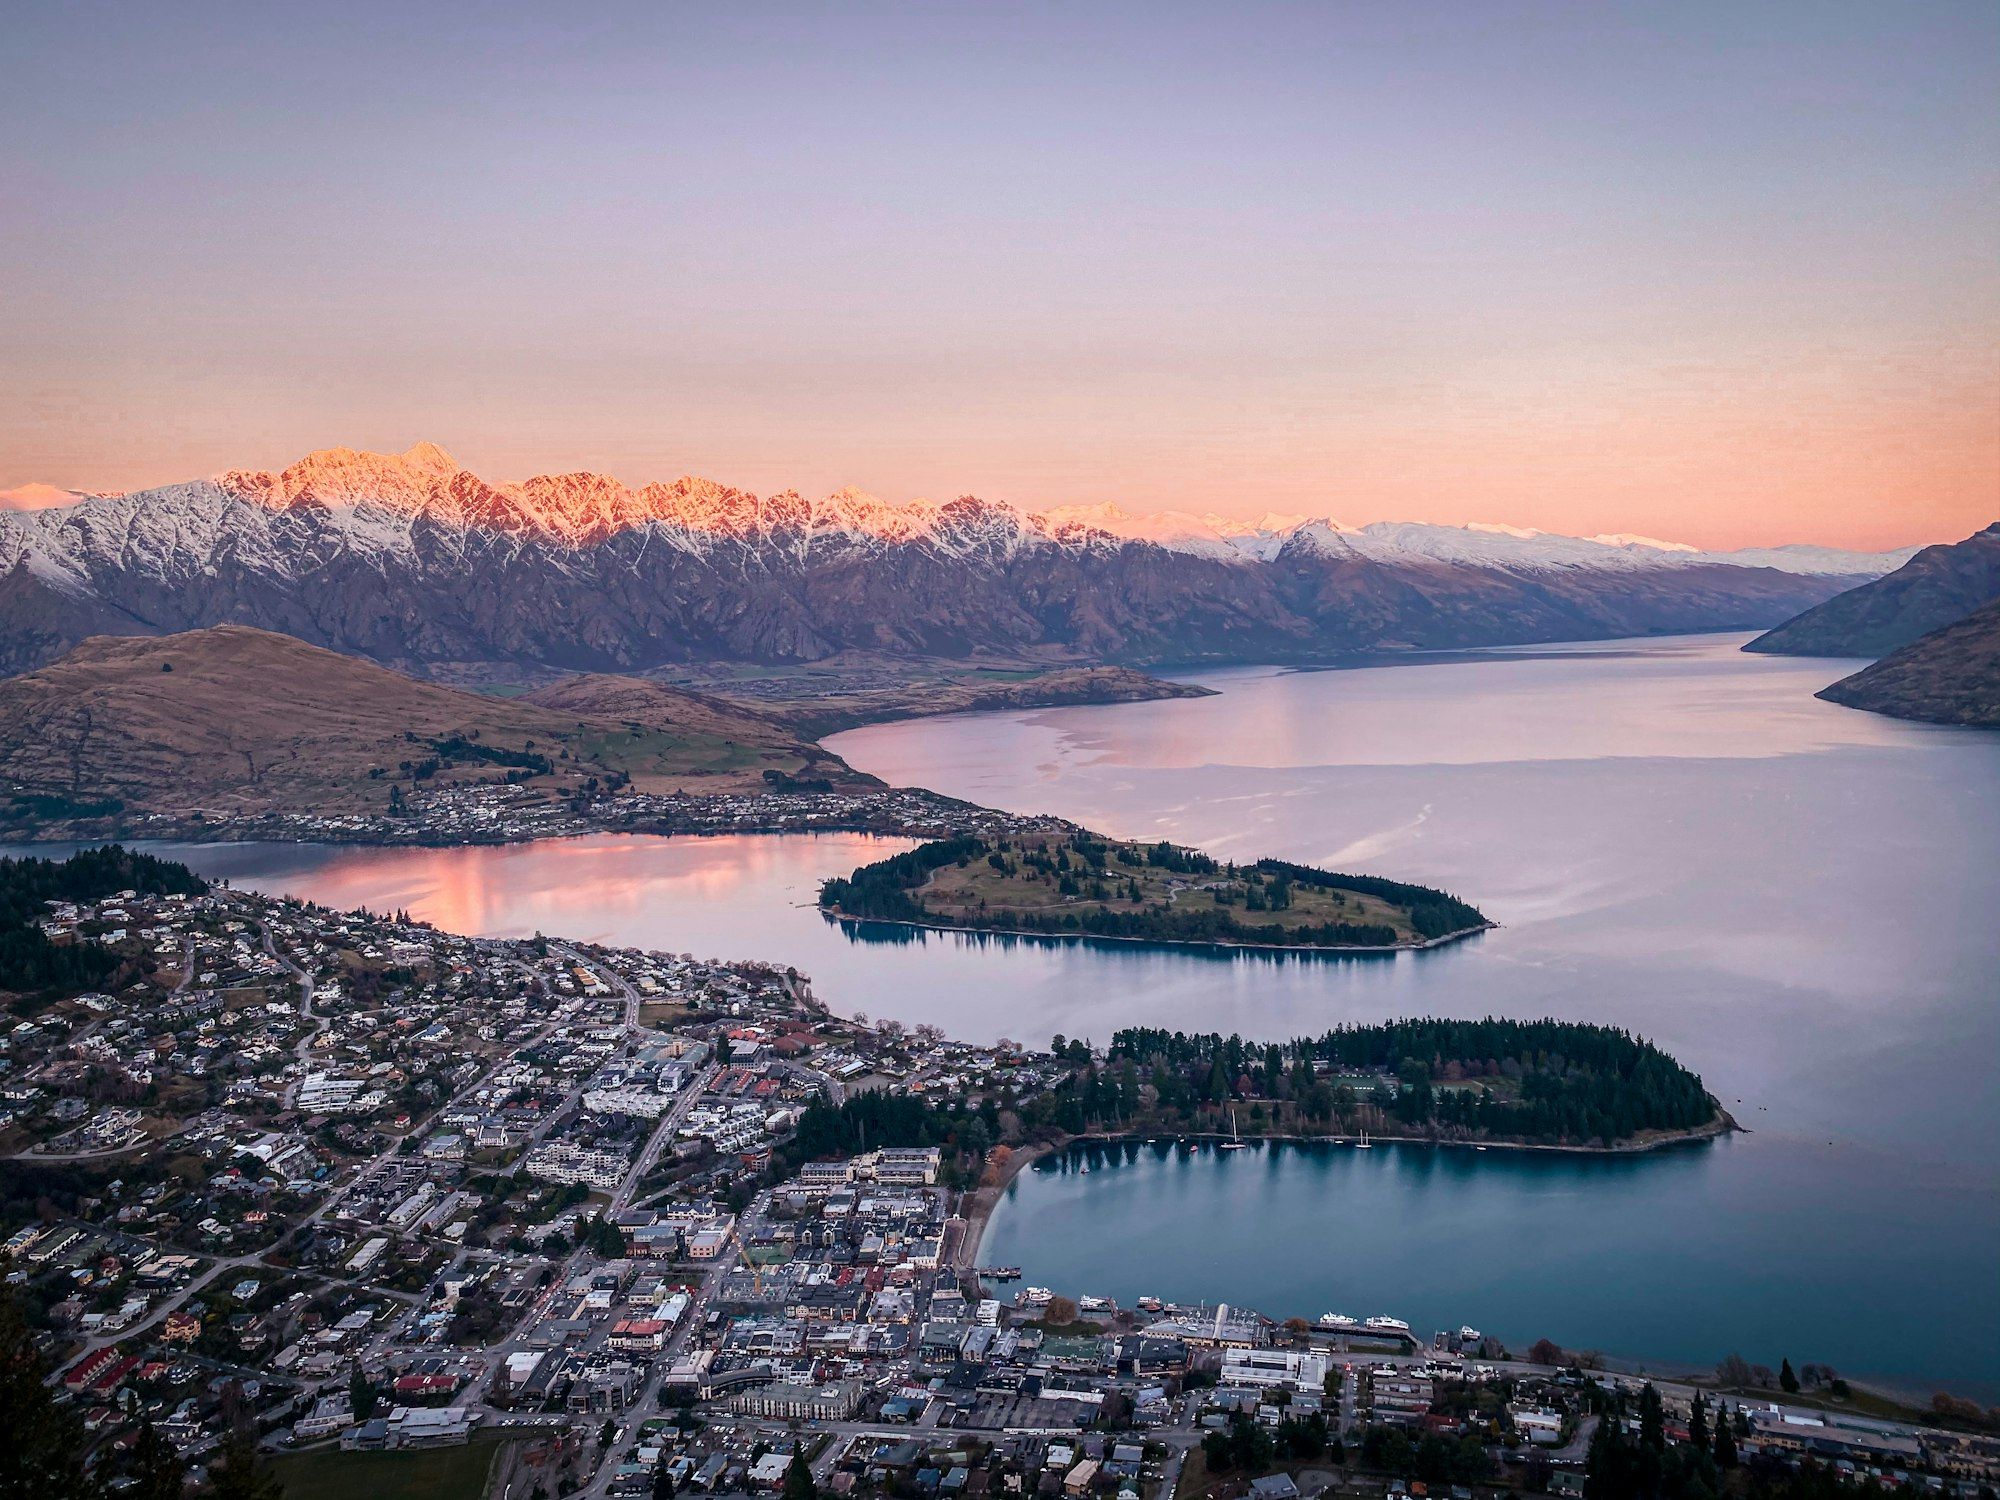
Queenstown has two peaks — summer and the ski season — with quieter shoulders in late autumn and late spring. Reporting in 2025 showed international arrivals into Queenstown of around 192,000 for January to August, up 14% on the previous year, with winter visitation up about 10% and Australians making up around 40% of international arrivals (NZ Herald). The same report noted that spending hadn’t fully kept pace with visitor numbers, and that wage costs were a key pressure.
Rotorua
Rotorua’s geothermal and cultural attractions support year-round demand, with peaks in summer and school holidays. Winter is typically steadier here than in beach destinations.
Bay of Islands and Northland
Strongly summer-weighted. Boat tours, beaches and holiday accommodation create a pronounced peak from Christmas to Easter and a long quiet winter.
Other regions
Nelson Tasman, the Coromandel and Hawke’s Bay follow a summer-heavy pattern. Wellington and Auckland are more even because of business travel and events.
Where to get monthly data
MBIE funds the Accommodation Data Programme, managed by Fresh Information. It collects monthly data from commercial accommodation providers with at least six stay units and reports guest nights and occupancy at national and regional levels. It’s the best free source for checking how your region’s seasons compare year to year.
Other useful sources:
- Stats NZ international travel releases — monthly visitor arrivals by country.
- Regional tourism organisations — many publish monthly snapshots.
- Infometrics quarterly economic monitors — regional guest night trends.
Turning data into a cash plan
Data is only useful if it changes your decisions. Here’s how to use it:
- Chart your own monthly revenue for the last two years.
- Overlay regional guest nights from the Accommodation Data Programme.
- Identify the gap months — where your revenue falls below your fixed costs.
- Check the trend — are the quiet months getting longer or shorter?
- Plan staffing and spending around the pattern, not the annual average.
- Arrange funding before the trough rather than during it.
Our seasonal cash flow plan guide walks through the forecasting step by step.
What the headline numbers don’t tell you
Record visitor numbers don’t automatically mean record profits. Several pressures sit behind the headline figures:
- Spending per visitor. Queenstown businesses noted in 2025 that discretionary spending hadn’t fully kept pace with visitor numbers, and domestic visitors weren’t spending what they used to.
- Labour costs. Wage inflation and tight labour markets in resort towns push up the cost of every busy week.
- Shorter booking windows. Late bookings make it harder to forecast staffing and stock.
- Weather and events. A slow snow season, a storm-damaged road or a cancelled event can remove weeks of revenue from one region while others are unaffected.
That’s why a tourism business’s own numbers matter more than national totals. Use the official data for context and trend, and your own bookings and bank statements for decisions.
What the numbers mean for funding
Lenders assessing a tourism business want to see that the seasonal pattern is consistent and that the peak clears the trough. Regional data helps make that case: if your quiet June mirrors the region’s, it’s clearly seasonal rather than a sign of decline.
If you need to carry costs through a quiet stretch, a business line of credit suits businesses usually trading six months or more, and a property-secured loan of $20,000 to $1m suits bigger needs. See our tourism and hospitality funding page for how we help.